ADA eyes $0.156 drop amid sixth straight weekly decline
Cardano faces a potential drop to $0.156 amid its sixth consecutive weekly decline. Bearish derivatives data, negative funding rates, and sell-side dominance highlight ongoing downward pressure across spot and futures markets.

Key takeaways
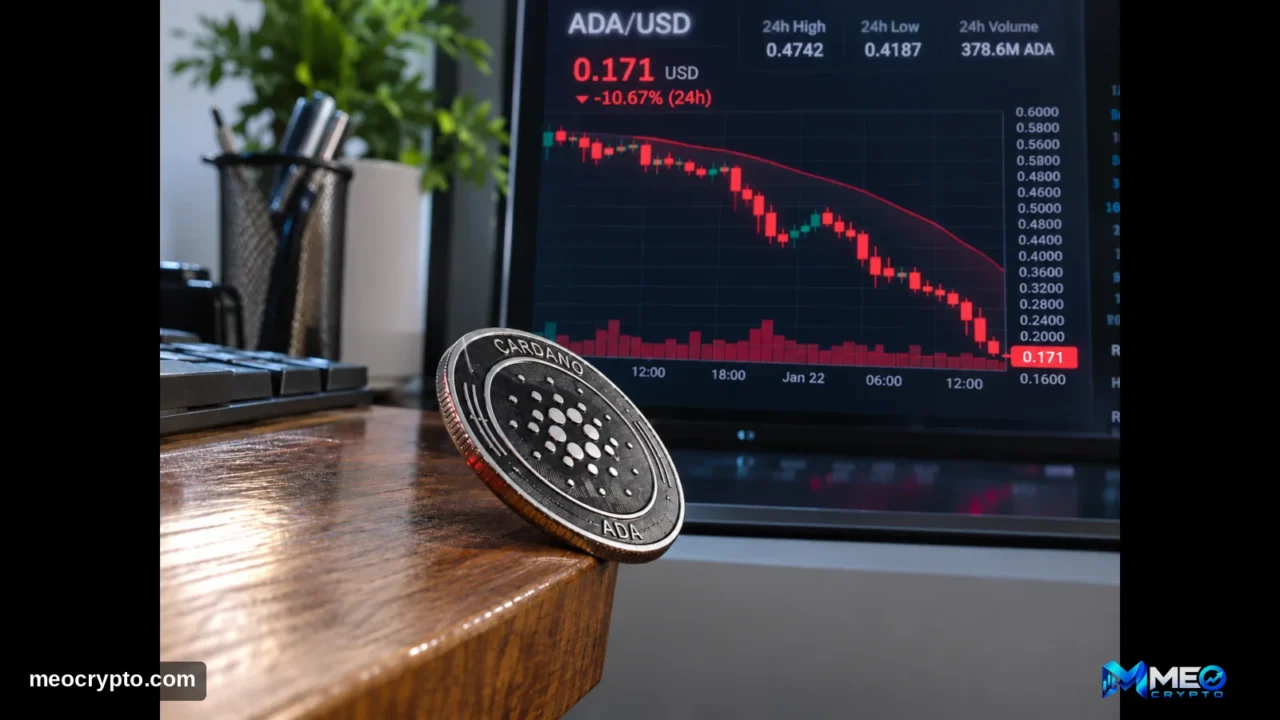
- Cardano (ADA) changes hands near $0.171 on Friday, pushing its weekly losses close to 4%.
- Sustained selling pressure and declining investor confidence have pushed ADA down by more than 30% since early October.
- ADA confronts immediate support at $0.156, while overhead resistance is found at $0.183 and the $0.203–$0.229 EMA cluster.
Cardano (ADA) extended its downward trajectory on Friday, changing hands around $0.171 as declining derivatives activity and bearish on-chain signals heightened fears of additional losses.
The digital asset has dropped nearly 4% over the week, putting it on track for its sixth successive weekly decline. This ongoing correction has wiped out over 30% of its valuation since the start of October.
Derivatives market participants are increasingly adopting defensive positions, pushing Cardano’s long-to-short ratio close to a one-month low while funding rates dip into negative territory.
Cardano derivatives signal bearish sentiment as long-to-short ratio falls
The Cardano derivatives sector continues to highlight flagging investor sentiment as traders ready themselves for more downside.
Data from CoinGlass shows that ADA’s long-to-short ratio sits at 0.86, nearing its weakest point in over a month.
A reading below 1 reveals that short positions outnumber long positions under the tracked metric, indicating that bearish strategies have taken precedence.
Funding rates provide further proof of the deteriorating sentiment. Cardano’s funding rate flipped negative on Thursday and rested at -0.0015% by Friday.
This mix of heavy short positioning and negative funding implies that market participants remain hesitant to count on a lasting price rebound.
On-chain metrics and trading indicators further illustrate that market conditions for Cardano remain challenging.
Summary statistics from CryptoQuant show that both the spot and futures markets for ADA are seeing heavy whale orders alongside elevated trading volume.
The metrics also point to sell-side dominance across both markets. CryptoQuant signals reveal that major market participants stay active while aggressive selling continues to overshadow buying momentum.
Cardano price forecast: ADA remains below major moving averages
The technical outlook for Cardano stays pessimistic as the token continues to trade underneath its primary daily Exponential Moving Averages (EMAs).
At the time of writing on Friday, ADA hovers around $0.171, resting well below its 50-day EMA at $0.203.
The 100-day EMA is situated near $0.208, and the 200-day EMA rests around $0.229.
Trading beneath all three of these averages indicates that sellers retain command over short-, medium-, and long-term price directions.
Momentum oscillators offer little sign of an imminent bullish turnaround. The daily Relative Strength Index (RSI) has dropped to roughly 29, pushing Cardano into oversold conditions.
At the same time, the Moving Average Convergence Divergence (MACD) stays in negative territory, with the histogram pointing to muted momentum.
This implies that downward pressure persists, even if the velocity of the sell-off may be leveling off.
Altogether, these signals indicate that Cardano’s broader downward trend remains active, despite the potential for a short-term bounce.
The next critical downside support for Cardano is positioned at $0.156. This horizontal floor might draw buying interest as traders evaluate whether the recent pullback has gone too far.
Successfully defending the $0.156 mark could enable ADA to consolidate and potentially mount a short-lived recovery. Conversely, a decisive breakdown under this support would further damage the technical outlook.
Despite the prevailing bearish structure, Cardano could attempt a rebound if buyers successfully safeguard the $0.156 support line.

The initial major resistance barrier sits at $0.183. A decisive push past this threshold would signal that short-term buying pressure is picking up.
Even so, ADA would still encounter a notable resistance cluster between $0.203 and $0.229, where its principal daily EMAs converge.
The 50-day EMA at $0.203 serves as the initial dynamic hurdle. Beyond that point, the 100-day EMA near $0.208 and the 200-day EMA around $0.229 could cap additional gains.
Surpassing these moving averages would deliver more conclusive evidence that Cardano’s bearish framework is starting to mend. Additional resistance levels are located at $0.236, $0.245, and $0.296.